Client
Boston Council
Tools
Python Pandas and scikit-learn (Regression Analysis); Python Seaborn and Matplotlib (Data Visualization)
Extension Analysis
Detailed extension data analysis is available to download as a jupyter notebook below.
Overview
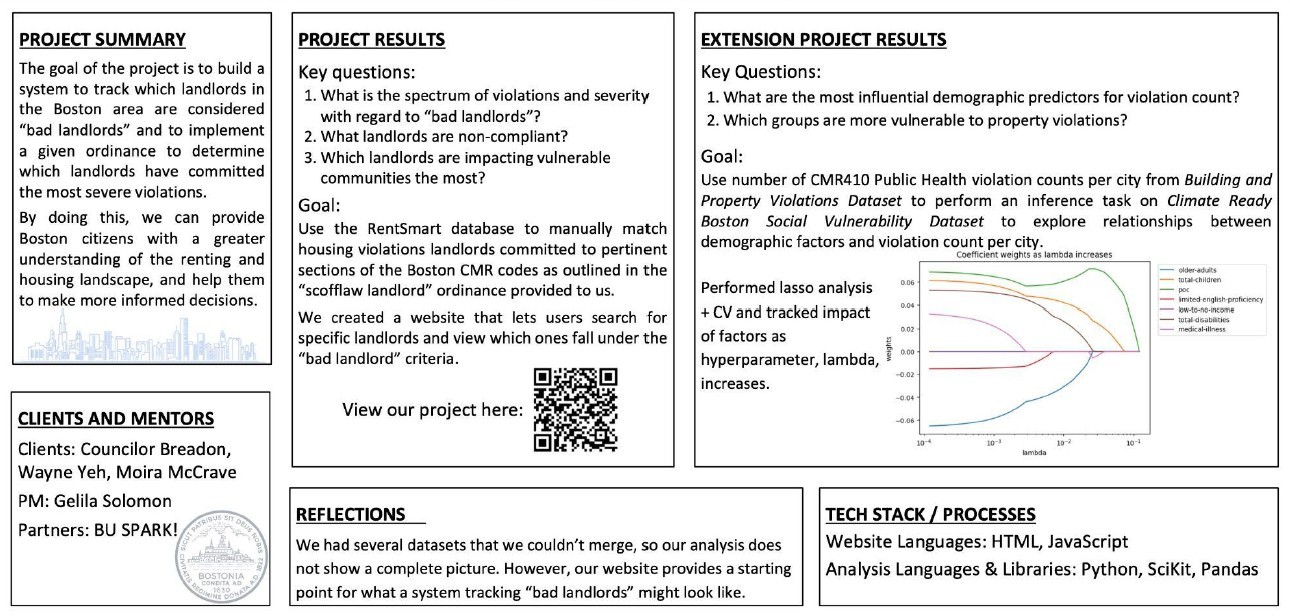
Working with Boston Councilor Breadon, our team analyzed Boston's property and rental datasets to identify problematic and scofflaw landlords. Our goal is to make the housing development process more transparent and accessible, helping the public make informed housing decisions and better understand their city's changing landscape.
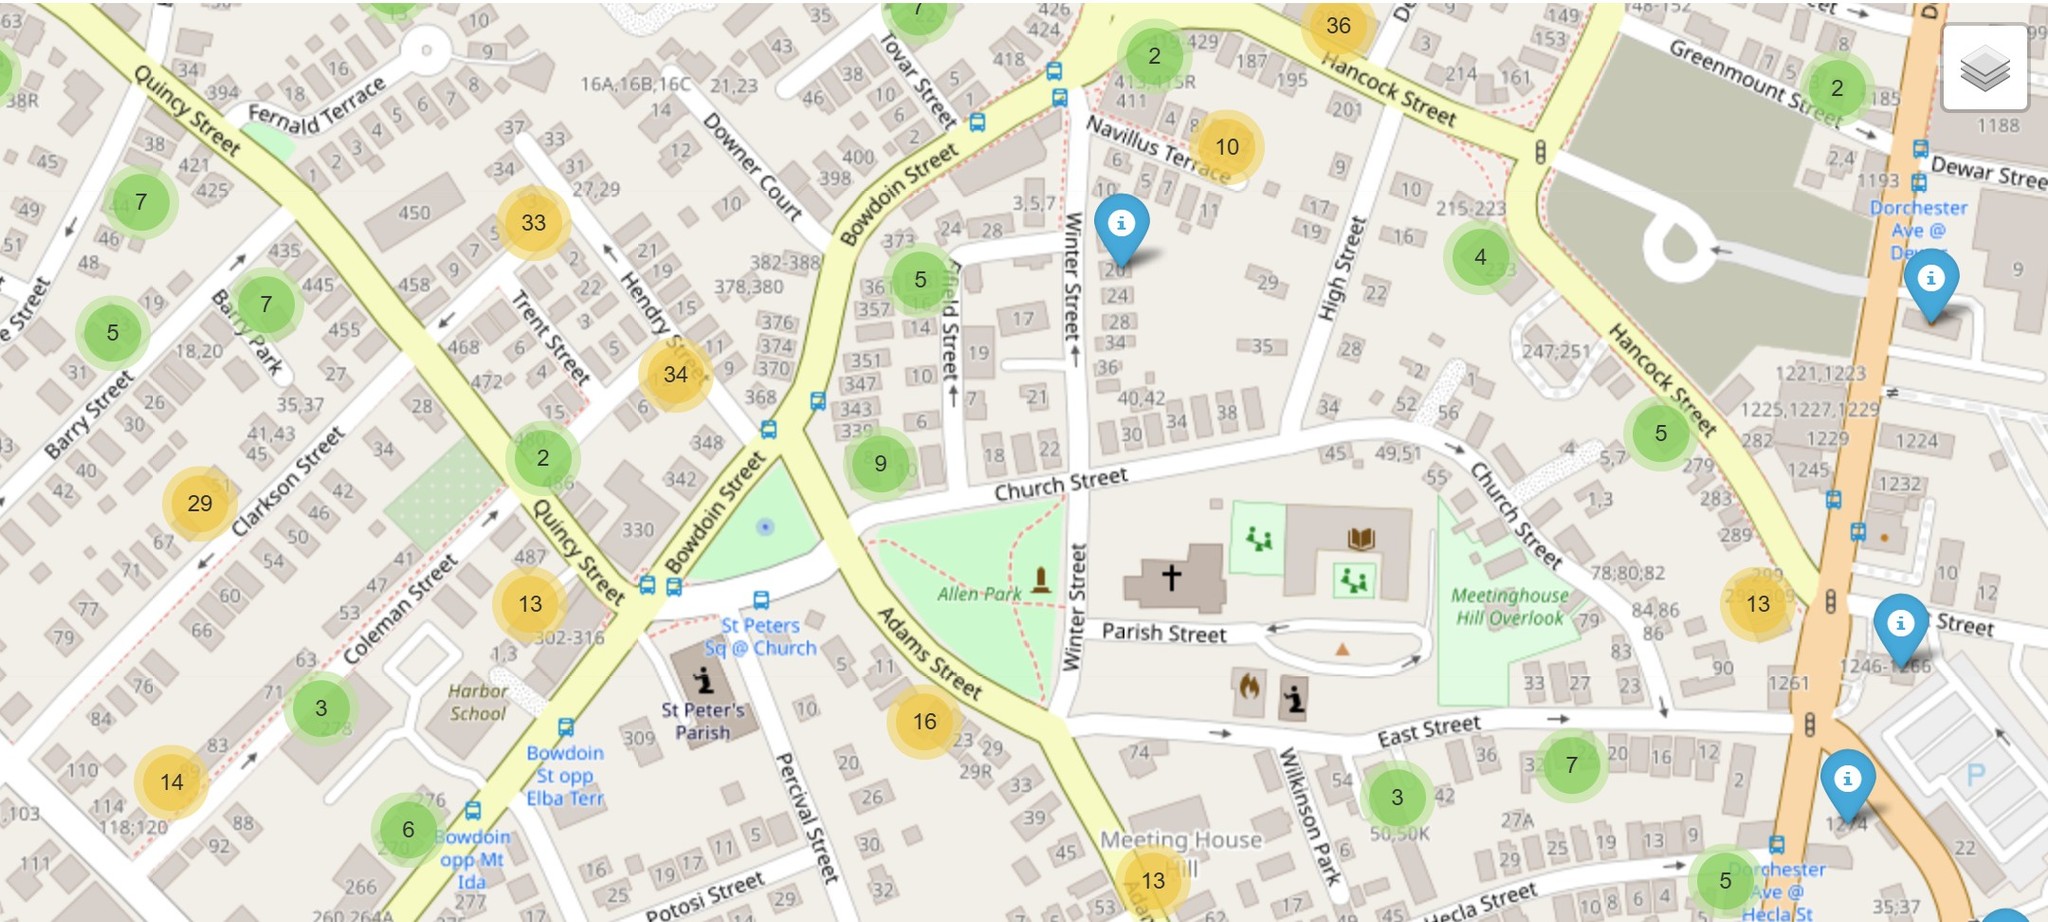
A Trackable System
After presenting a preliminary analysis of the dataset, we proceeded to create a trackable map system of property violations across the Boston area as well as a matrix to classify landlord behavior. Users can use the search to view property violations by property owners.
Extension Analysis
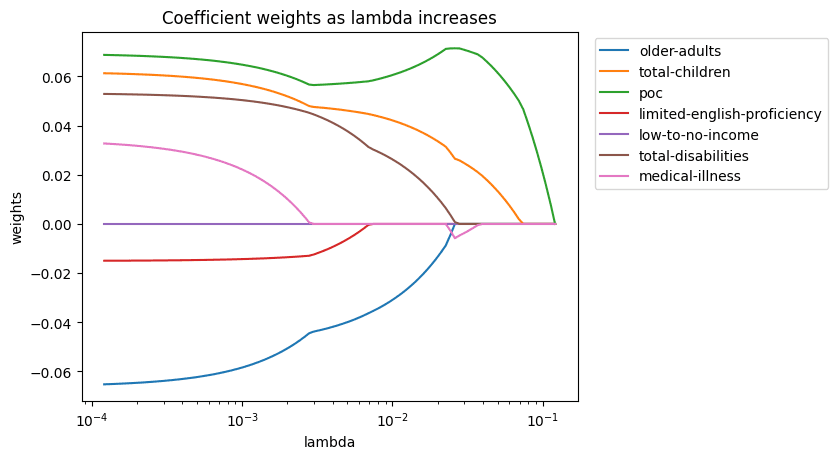
Using lasso regression analysis, we found that coefficients that are correlated to an increase in property violations include the number of POC, disabilities, and children in a building. We recommend the Boston Council to explore these findings with field research to determine causality.